


Our solutions are tailored to each client’s strategic business drivers, technologies, corporate structure, and culture – addressing any industry-specific needs.
11/14/2023
2023 Affordable Housing Credit Study and Credit Tool
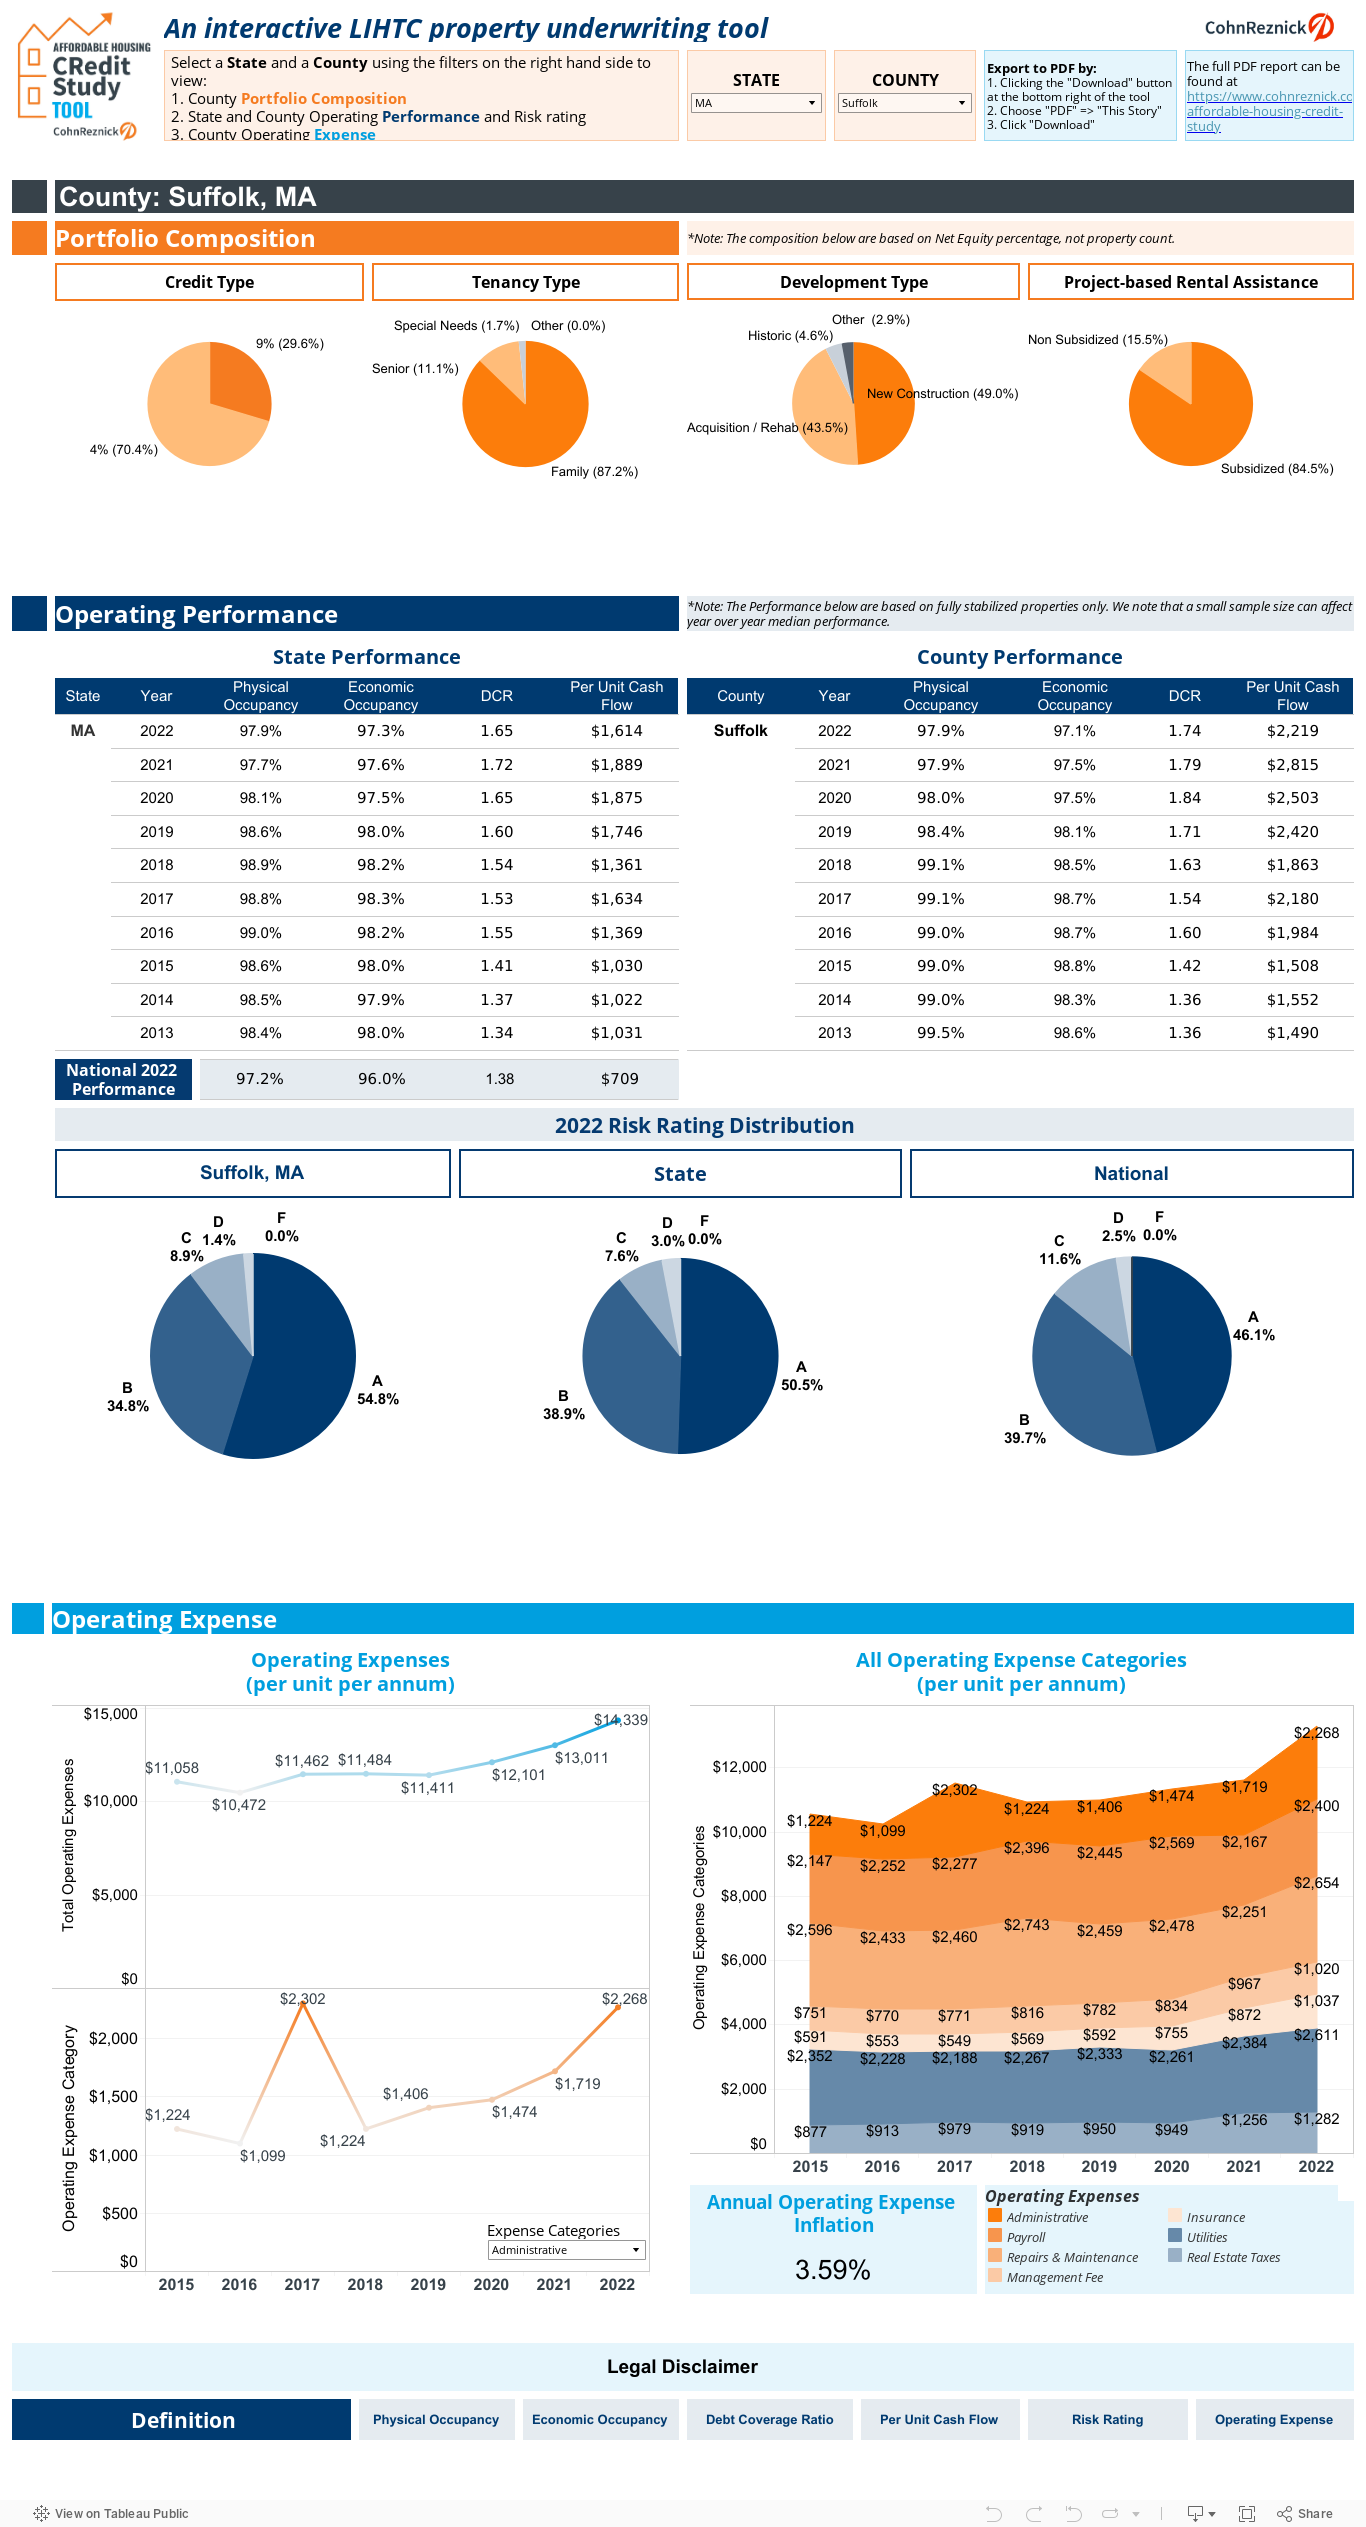
The 2023 Affordable Housing Credit Study provides data and insights into performance trends from more than 30,000 housing tax credit properties. You can also leverage this data through our interactive Affordable Housing Credit Tool.

The 2023 Affordable Housing Credit Study, the latest in our biennial series, provides comprehensive data, analysis, and insight into critical performance trends across a surveyed portfolio of affordable housing properties financed with federal low-income housing tax credits (LIHTCs). With industry-wide operating and performance data current through year-end 2022, the report can help the affordable housing community benchmark portfolios, develop best practices, and gain industry insights.
Plus: Use our interactive Credit Tool, now updated with the latest data, to explore historical national, state, and county-based operating performance trends.
Access now

Close
Contact
Let’s start a conversation about your company’s strategic goals and vision for the future.
Please fill all required fields*
Please verify your information and check to see if all require fields have been filled in.

LIHTC property performance: Trends and analysis
Join leaders from CohnReznick’s Tax Credit Investment Services group for an overview of how to use the study to benchmark portfolios, develop best practices, and gain valuable insights into the affordable housing industry. In addition to discussing the LIHTC industry’s performance during the pandemic, panelists will share insights about trends in construction delays, collection losses, and rising operating expenses, and, more importantly, how the industry worked to mitigate these challenges.
Receive CohnReznick insights and event invitations on topics relevant to your business and role.
CohnReznick has used information gathered from the housing credit industry participants listed on the Acknowledgements page of this report to compile this study. The information provided to us has not been independently tested or verified and may include estimations, approximations, and assumptions. We have relied exclusively on the study participants for the accuracy and completeness of the information contained herein. Accordingly, we cannot guarantee the accuracy or completeness of any of the information contained herein.
Any information contained in this report is not intended as a thorough, in-depth analysis of specific issues. Nor is it sufficient to avoid tax-related penalties. The report has been prepared for informational purposes and general guidance only and does not constitute legal or professional advice. You should not act upon the information contained in this report without obtaining specific professional advice particular to your individual situation. No representation or warranty (express or implied) is made as to the accuracy or completeness of the information contained in this publication, and CohnReznick LLP, its partners, employees and agents accept no liability, and disclaim all responsibility, for the consequences of you or anyone else acting, or refraining to act, in reliance on the information contained in this report or for any decision based on it . Reproduction of any of the information contained herein for any purpose is strictly prohibited .